import numpy as np
import scipy.io as io
import matplotlib.pyplot as plt
from scipy.interpolate import InterpolatedUnivariateSpline
from scipy.optimize import curve_fit
np.random.seed(0)
x = np.arange(0, 37)
data_or = np.sin(x) + np.random.normal(scale=0.3) + 1
y = np.arange(0, 40)
data_ref = np.sin(2*y) + np.random.normal(scale=0.3) + 1
pdf_or = (np.arange(len(x)) + 1) / (len(x))
pdf_ref = (np.arange(len(y)) + 1) / (len(y))
spl = InterpolatedUnivariateSpline(pdf_or, np.sort(data_or))
data_or_interp = spl(pdf_ref)
def func(x, a, b, c, d):return a*x + b*x**2 + c*x**3 + dpopt = curve_fit(func, data_or_interp, np.sort(data_ref))[0]
data_corrected = func(data_or, *popt)
plt.rcParams['font.size'] = 12
plt.rcParams['font.family'] = 'Times New Roman'
fig, ax = plt.subplots(1, 1, dpi=300, figsize=(4, 4))
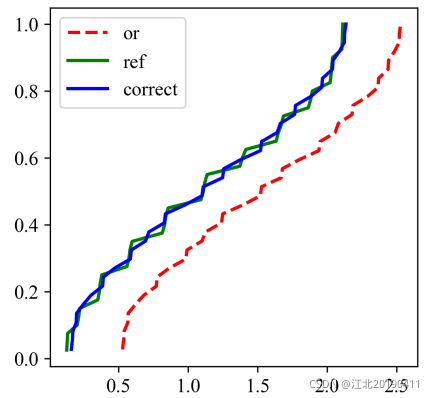
ax.plot(np.sort(data_or), pdf_or, label='or', linewidth=2, c='r', linestyle='--')
ax.plot(np.sort(data_ref), pdf_ref, label='ref', linewidth=2, c='g')ax.plot(np.sort(data_corrected), pdf_or, label='correct', linewidth=2, c='b')
ax.legend()